Biological Age: What It Is, What It Isn't, and Why We Built Our Own
You've probably seen the claim: your body is actually 35, even though you're 42. But what does that number mean? We explain PhenoAge, reveal a hidden age bias in the most cited algorithm, and show what we changed.
Written by
Damir Kairov
Published on
April 23, 2026
What is biological age?
You age at a rate of exactly one year per year. That's your chronological age — a clock that ticks the same for everyone.
But not everyone ages the same. Two 50-year-olds can have wildly different health trajectories depending on genetics, lifestyle, environment, and plain luck. The concept of biological age tries to capture that difference: a number that reflects how your body is actually doing, rather than how long you've been alive.
The idea has been around in gerontology research for decades, but it's entered the mainstream recently thanks to consumer health products and longevity-focused companies — including us. The appeal is obvious: if you could track your biological aging rate over time, you could see whether your interventions (diet, exercise, sleep, supplements) are actually moving the needle.
The landscape: how biological age is measured
There's no single accepted way to measure biological age. Different approaches use different inputs:
Epigenetic clocks (Horvath, Hannum, GrimAge, DunedinPACE) analyze DNA methylation patterns — chemical marks on your genome that change with age. These require specialized lab assays and are mostly used in research.
Blood-based clocks (PhenoAge, KDM Biological Age) use routine blood biomarkers like glucose, albumin, and inflammatory markers. These are more accessible because they use standard blood panels.
Composite scores (various proprietary ones) combine blood work with other data — fitness metrics, imaging, questionnaires.
Each approach has strengths and limitations. Epigenetic clocks are the most studied in academic settings. Blood-based clocks are cheaper and more practical. No single method has been validated as the definitive measure of aging.
At Aniva, we use a blood-based approach built on PhenoAge[1] — one of the most cited and validated algorithms in the field. When we looked closely at the math behind it, though, we found a specific bias worth understanding, and worth fixing.
How PhenoAge works
PhenoAge was published in 2018 by Morgan Levine and Steve Horvath. It's one of the most widely used blood-based biological age algorithms, validated across multiple large cohorts for predicting mortality, disease incidence, and physical decline.
Under the hood, it's a mortality risk score converted into units of years:
Step 1: Predict your risk of dying
Levine's team took data from NHANES III — a large, nationally representative US health survey with over 20 years of mortality follow-up — and fitted a survival model. The model takes 9 routine blood biomarkers plus your calendar age and estimates your probability of dying within 10 years:
Biomarker
What it reflects
Albumin
Liver function, nutrition
Creatinine
Kidney function
Glucose
Metabolic health
C-reactive protein (log)
Inflammation
Lymphocyte %
Immune function
Mean cell volume
Red blood cell size
Red cell distribution width
Red blood cell variability
Alkaline phosphatase
Liver / bone
White blood cell count
Immune activity
These are routine markers — the kind you'd find on a standard blood panel.
Why this works: biomarkers track aging
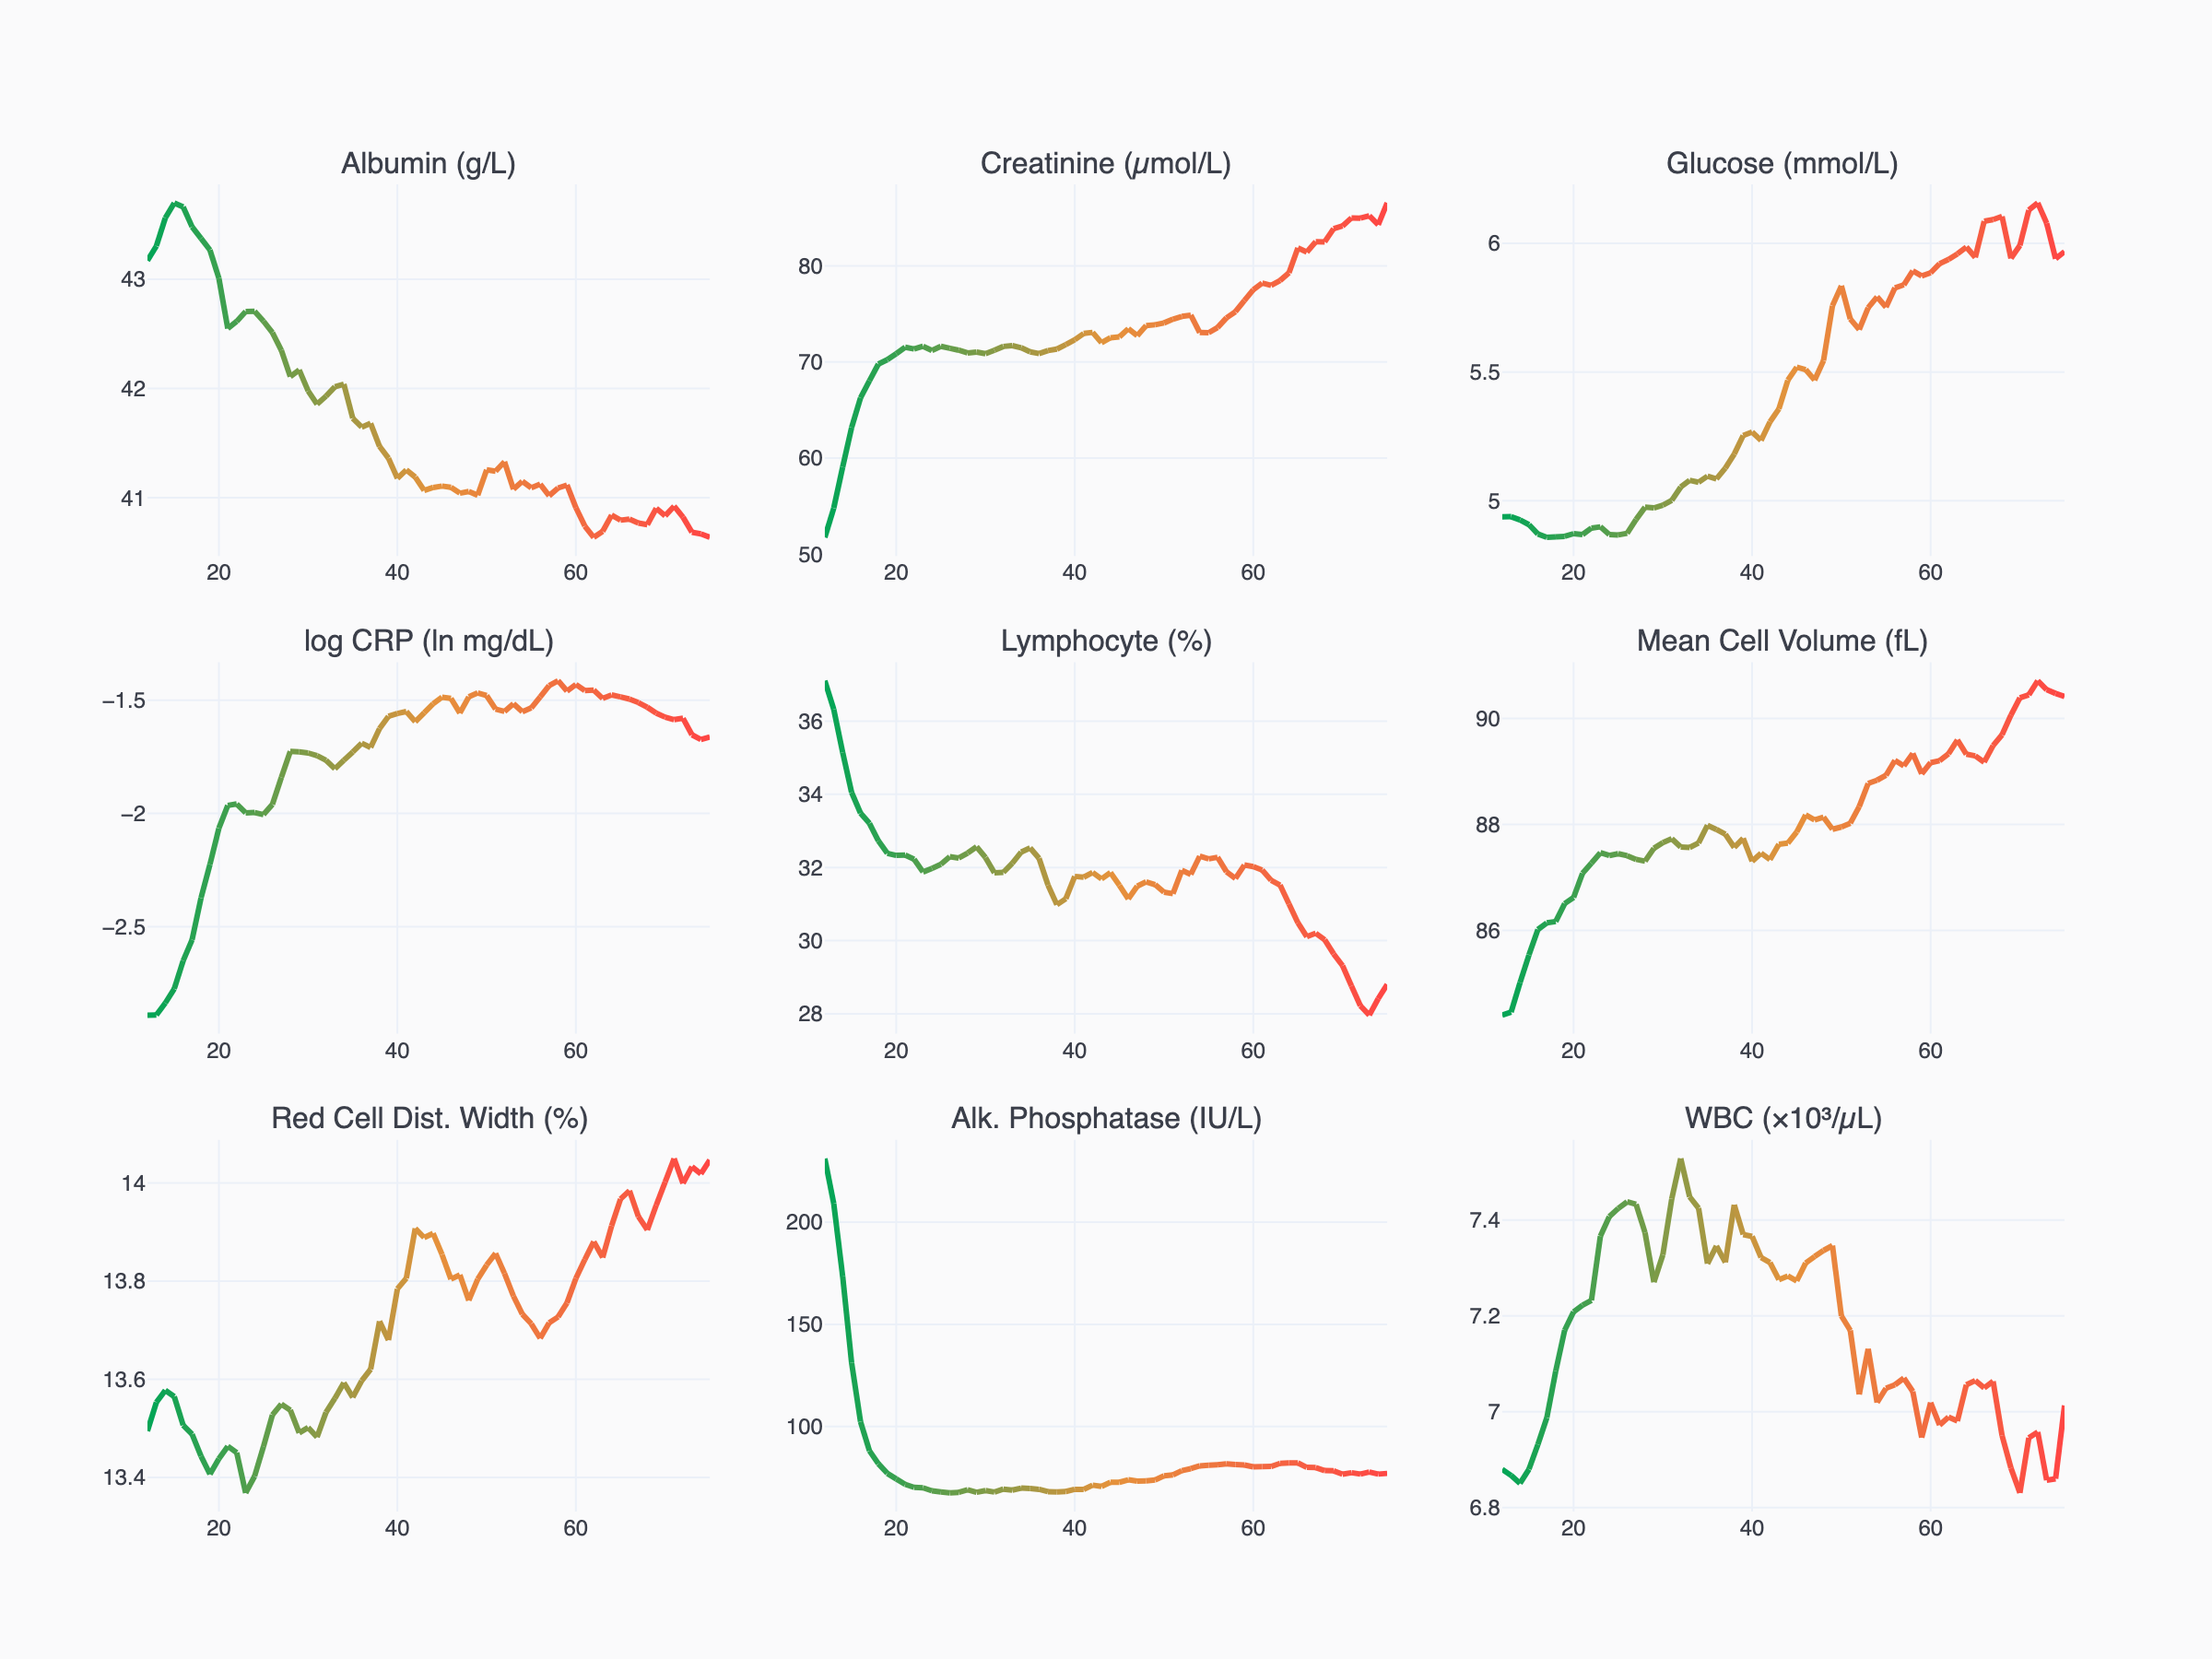
The intuition behind blood-based biological age is straightforward — these biomarkers genuinely change as you get older. When we plotted the average trajectory of each biomarker across 20,000+ NHANES participants from age 12 to 80, the pattern is clear.
Albumin and lymphocyte percentage decline. Glucose, creatinine, CRP, and red cell distribution width rise. Some, like alkaline phosphatase, follow more complex curves. But the overall direction is consistent: your blood work at 60 looks measurably different from your blood work at 30.
This is what makes a biological age score possible in the first place. If your glucose, CRP, and RDW look more like a typical 40-year-old's when you're actually 50, that's a signal — your metabolic and inflammatory profile is aging slower than average. The algorithm is simply quantifying that comparison.
Step 2: Convert risk back to "years"
This is where it gets interesting. A cumulative mortality probability like 4.2% isn't intuitive. So the formula asks: at what age would an average person have this same mortality risk? If your blood work gives you the mortality risk of a typical 52-year-old but you're actually 45, your PhenoAge is 52. You're "biologically older" than your calendar age.
This is clever. It's also where the problem starts.
The age-dependent bias in PhenoAge
Here's something we noticed when we dug into the math. "Average person" in PhenoAge means average across the entire population — everyone from age 20 to 80+, pooled together into a single set of reference biomarker values. But biomarkers aren't constant across age. A 25-year-old with perfectly normal-for-their-age blood work will have better values than the population-wide average, because that average includes 60- and 70-year-olds with naturally higher glucose, higher CRP, and lower albumin.
The result is a systematic stretching effect:
If you're young with normal biomarkers, PhenoAge says you're even younger. A healthy 25-year-old might score 19.
If you're old with normal biomarkers, PhenoAge says you're even older. A healthy 70-year-old might score 76.
Only near the population's mean age (~mid-40s) does PhenoAge roughly equal your calendar age for someone aging normally.
This isn't a subtle effect. When we computed PhenoAge for over 20,000 NHANES participants (ages 12–79), the regression slope of PhenoAge against calendar age was 1.21 — meaning for every year of actual age, PhenoAge moves by 1.2 years. The youngest age decile showed a mean "acceleration" of −5.8 years; the oldest showed +6.4. (The widely used implementation from Levine's supplement uses a slightly different inversion that reduces this to a slope of ~1.06, but the same directional bias remains.)
Levine's team was aware of this — for their research purposes, it didn't matter. They wanted a comparative metric: who is aging faster or slower than their peers. For ranking, the bias cancels out. But if you're a 28-year-old looking at a PhenoAge of 22 and thinking your biology is six years younger, that's mostly an artifact of the math, not a reflection of exceptional health.
What we changed
The fix is conceptually simple: instead of comparing your biomarkers to the population-wide average, compare them to the average for people your age.
We computed age-specific reference values for each of the 9 biomarkers using NHANES data (over 20,000 participants), then recalculated PhenoAge using these age-matched references instead of the global population average.
Method
Slope vs calendar age
Bias (young)
Bias (old)
Standard PhenoAge
1.06–1.21*
−1.5 to −5.3 years
+1.6 to +6.1 years
Aniva Biological Age
1.00
0.0 years
0.0 years
The range depends on which inversion formula is used; the commonly implemented version from Levine's supplement sits at the lower end.
Aniva Biological Age achieves a slope of 1.00 with zero bias across all age groups — perfect calibration.
A slope of 1.0 means perfect calibration: for someone aging normally for their age, our score equals their calendar age. Deviations from zero reflect actual differences in your biomarker profile relative to your peers, not an artifact of comparing yourself to the wrong reference group.
We use a 1-year age window for the reference values, with 130–500 NHANES participants per age — more than enough for stable estimates. (We also tested 3- and 5-year windows and got essentially identical results, confirming the 1-year resolution is statistically sufficient.)
What your Aniva Biological Age means
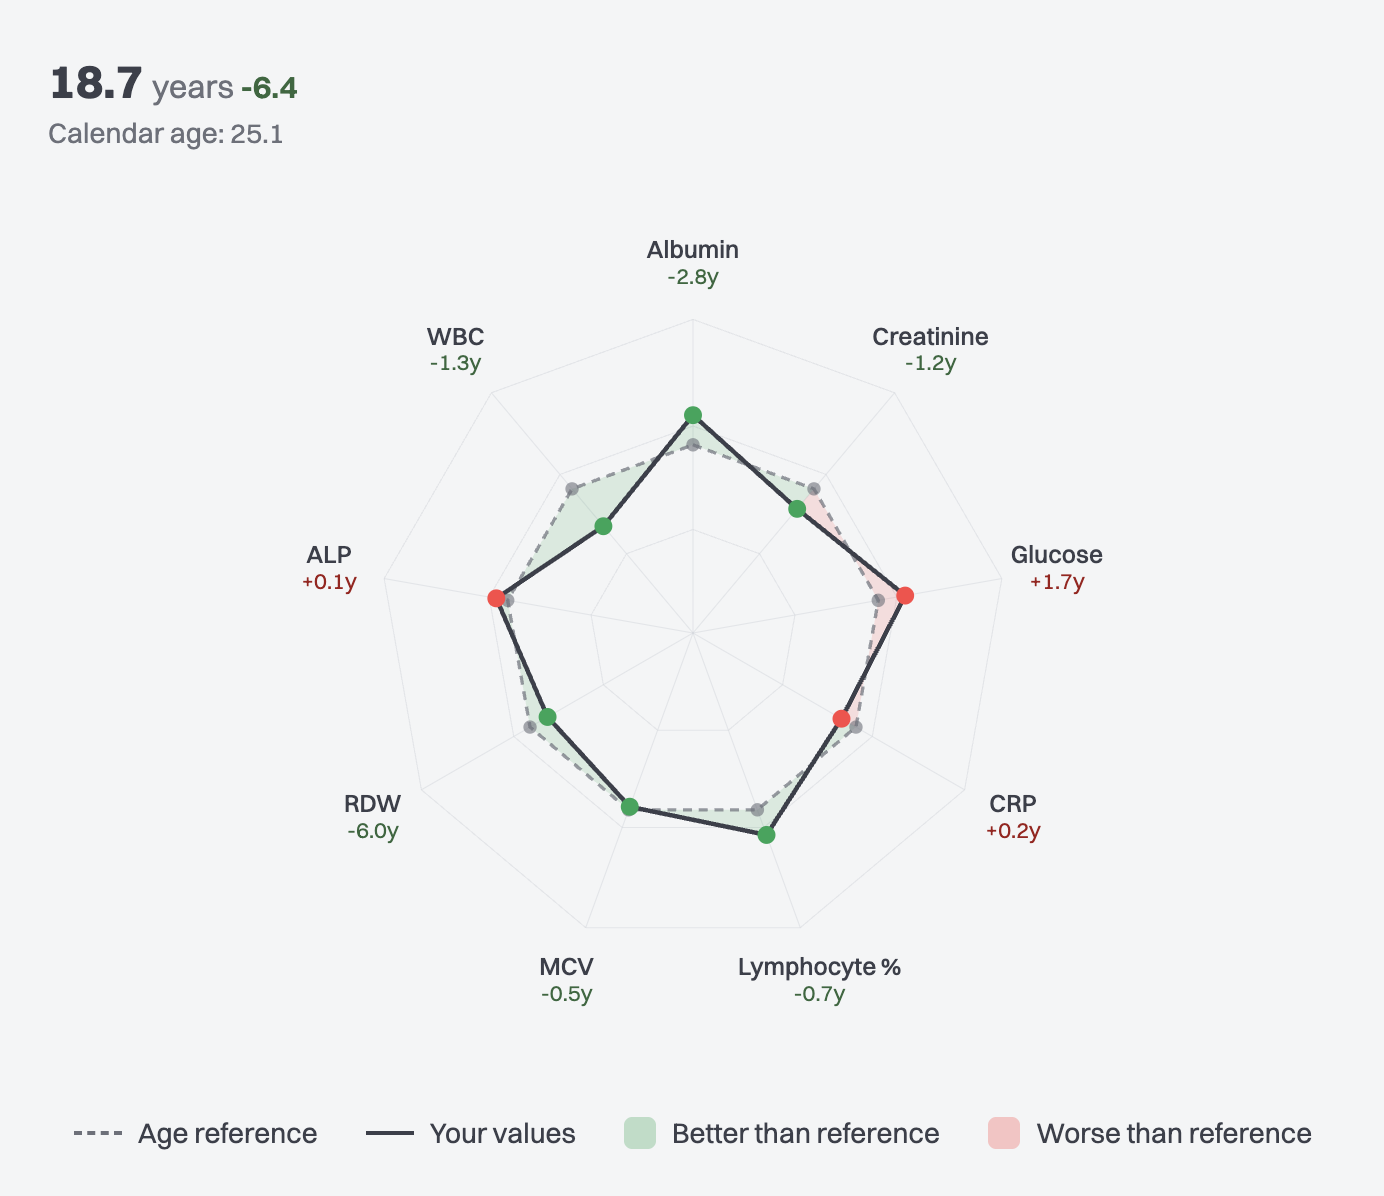
You see two numbers: your biological age (e.g. 18.7 years) and the acceleration next to it (e.g. −6.4) — the difference from your calendar age of 25.1. A negative acceleration means your biomarker profile looks younger than your age; positive means older; near zero means typical.
Below that, a radar chart breaks down each of the 9 biomarkers individually, showing which ones are pulling your score up or down and by how many years. So you can see not just the headline number, but exactly what's driving it — maybe your RDW is excellent (−6.0y) and your albumin is strong (−2.8y), but your glucose is pulling the other way (+1.7y).
This is the same PhenoAge model, the same 9 biomarkers, the same mortality-risk weights from the same survival model trained on the same NHANES data. The only difference is the reference point: we compare you to people your age, not to the entire population.
One caveat worth noting: both the original PhenoAge and our correction use NHANES — a US population sample. American health averages skew worse than many other countries on metabolic markers (glucose, CRP, BMI-correlated values), which means the reference "normal" may be more lenient than what you'd see in, say, a Scandinavian or Japanese cohort.
The honest takeaway
No biological age score — ours included — is a literal measurement of how old your body is. There is no blood test for that, and anyone who claims otherwise is overselling.
What these scores can do is collapse multiple health-relevant biomarkers into a single interpretable number, one that's been validated against real outcomes like mortality and disease incidence. The value isn't in any single reading. It's in the trend — tracking how your score changes over time as you adjust your habits, diet, sleep, or treatments. A well-calibrated score makes that trend meaningful. A biased one adds noise.
The biomarkers and their weights
In the interest of full transparency, here are the exact coefficients from the Levine 2018 PhenoAge model that we use:
Biomarker
Weight
Direction
Albumin (g/L)
−0.0336
Higher is better
Creatinine (umol/L)
+0.0095
Lower is better
Glucose (mmol/L)
+0.1953
Lower is better
C-reactive protein, log (mg/dL)
+0.0954
Lower is better
Lymphocyte %
−0.0120
Higher is better
Mean cell volume (fL)
+0.0268
Lower is better
Red cell distribution width (%)
+0.3306
Lower is better
Alkaline phosphatase (IU/L)
+0.0019
Lower is better
White blood cell count (1000/uL)
+0.0554
Lower is better
Calendar age (years)
+0.0804
—
A negative weight means higher values reduce your score (good). A positive weight means higher values increase it (bad, in the context of mortality risk). Red cell distribution width carries the most weight; alkaline phosphatase the least.
Our modification doesn't change these weights. It only changes what you're being compared against.